About me
From chaos to information with data art
As a child, I drew a lot. I pursued scientific studies, but always retained an appreciation for aesthetics. All of this shaped my desire to create tangible, analytical yet visually impactful work. I gravitated towards data and reveled in making it speaks, always with an artistic approach.
I started my data and analytics career in a media agency for 8 years. In 2011, I discovered Garr Reynolds, who greatly inspired me to create a « wow » effect in presentation, facilitating comprehension and decision-making. Then I spent 6 years in an automotive constructor digital team, handling data to explain, improve and make the executive decide. I am now CDO in a mid-size company and cover the whole data ecosystem including infrastructure, data governance, datavisualisation and AI.
The main pain I observed during all those years is the difficulty to get curated, aesthetic and easy to understand datavisualisation to make decision. Usually, people use a ton of dashboards, analysis and reports but struggle to find the right number, the right form and the right story that makes explanation and decision obvious. I found here my mission solving that issue met quite often, as people discover more and more the power of using their data.
Between Paris in France and Tallinn in Estonia, I cultivate this inspiration and perspective that allows me to create data art. Results are visible here: portfolio.
Why EXPICITDATA.ART?
Because I work on awesome AND comprehensive data art.
Why this logo ?
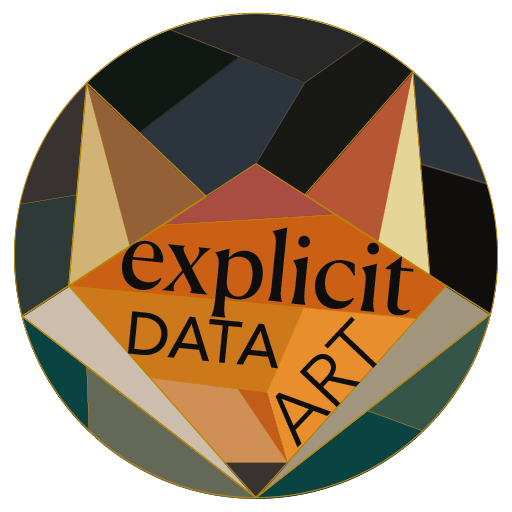
A fox head integrated into a Voronoi diagram: the link to data design is rather obvious. I grew up on the edge of a forest and spent countless hours in nature. Autumn was the most beautiful season for me with its thousands of shades of tree foliage. The fox is perceived as a curious animal that wanders and digs. This is also a bit of what data design is about: finding an interesting angle, digging, and analysing.
WANT TO TALK ABOUT REVIVING YOUR DATA ?
Just drop a message through the form below.

